Monitor nginx using Netdata
In this article we will see how to monitor Nginx using Netdata
Netdata is a system for distributed real-time performance and health monitoring. It is getting popular and is one of the trending repositories inside Github.
I have already wrote another post on netdata installation and basic setup. Please checkout here. In this article we will see how to monitor nginx using Netdata.
Netdata has a builtin plugin for Nginx, we will use it for monitoring nginx using Netdata. This plugin used the nginx “stub status” module to collect the metrics from nginx.
First we have to check if the “stub status” module is enabled in nginx. Use the following command to list the enabled modules and flags inside nginx
| 1 2 3 | nginx –V |
Sample output screenshot is below
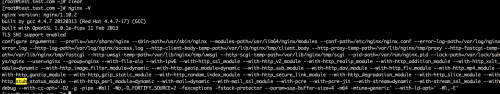
In the screenshot , you can see that stub module enabled. If not, you will have to recompile Nginx with stub module . Instructions are here
Configure Stub module in Nginx
Now we can configure “stub status” module in Nginx. It is pretty simple and straightforward.
Add the following directives inside your nginx “server” block
| 1 2 3 4 5 6 7 8 9 | location /stub_status { stub_status; # Security: Only allow access from the IP below. allow 127.0.0.1; # Deny anyone else deny all; } |
Config parameters are self explanatory. Once done with configuration changes, restart nginx on the machine. You can verify if the the module is working, by launching following url in browser or any shell client
| 1 2 3 4 5 6 7 8 | [root@test.test.com ~]# curl http://127.0.0.1/stub_status Active connections: 1 server accepts handled requests 818 818 825 Reading: 0 Writing: 1 Waiting: 0 [root@test.test.com ~]# |
Configure Netdata to Collect Nginx metrics
Netdata has builtin plugins to collect the nginx metrics, you can find the configuration files at “/etc/netdata/python.d/nginx.conf” .
By default, Netdata will poll the “stub status” endpoint ‘http://localhost/stub_status’ for collecting metrics. You will see the following in the config file
| 1 2 3 4 5 | localhost: name : ‘local’ url : ‘http://localhost/stub_status’ |
You can replace “localhost” with your IP address if needed. Most of the cases this is not required as we have Netdata installed on all the servers to collect the system metrics
Restart netdata if any changes made in the Netdata configurations.
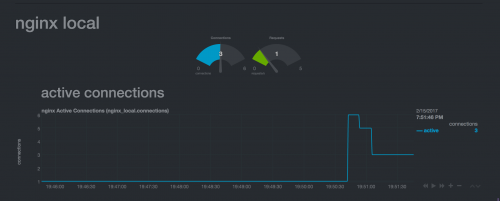
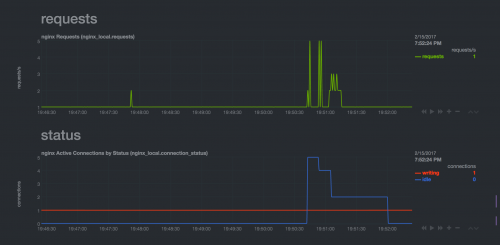
You should be able to see Nginx statistics inside Netdata now. Please see few screenshots below
You can also customize the Nginx hostname inside the Netdata configuration file.