Monitoring nginx with CollectD,Prometheus and grafana
Nginx is a popular web server which is is used as HTTP server,Loadbalancer and Generic TCP/UDP proxy. It has been running on many heavily loaded webservers and powering popular websites like Netflix, Workdpress.com and many more. In this article we will explain monitoring nginx with CollectD, Prometheus and Grafana. Nginx monitoring is useful for ensuring your web server availability and performance remains high.
The basic Nginx monitoring stats are provided by HttpStubStatusModule – metrics include requests/sec and number of open connections, along with stats for how fast requests are being handled. Let us see how to collect this metrics using Collectd, store the metrics data in time series database Prometheus and visualize it using Grafana.
Following components are there in this monitoring stack
- CollectD : Collect the metrics from nginx HttpStubStatusModule and forward to “Collectd Exporter” using “network” module
- Collectd Exporter : Accepts the metrics send by collectd ,transforms and exposes them for consumption by Prometheus.
- Prometheus : Polls the HTTP endpoint exposed by “Collectd Exporter” , pull the metrics data and store it in time series format.
- Grafana : Visualize the metrics data stored in Prometheus.
Now let us see how these components works together
1. Make sure HttpStubStatusModule is enabled in nginx
First we have to check if the “stub status” module is enabled in nginx. Use the following command to list the enabled modules and flags inside nginx
| 1 2 3 | nginx –V |
If not, you will have to recompile Nginx with stub module . Instructions are here
Configure stub module
Add the following directives inside your nginx “server” block
| 1 2 3 4 5 6 7 8 9 | location /stub_status { stub_status; # Security: Only allow access from the IP below. allow 127.0.0.1; # Deny anyone else deny all; } |
Once done with configuration changes, restart nginx on the machine. You can verify if the the module is working, by launching following url in browser or any shell client
| 1 2 3 4 5 6 7 8 | [root@test.test.com ~]# curl http://127.0.0.1/stub_status Active connections: 1 server accepts handled requests 818 818 825 Reading: 0 Writing: 1 Waiting: 0 [root@test.test.com ~]# |
2. Configure CollectD to get the metrics data from Nginx and forward it to “Collectd Exporter”
Add the following directives in the Collectd configuration
| 1 2 3 4 5 6 7 8 9 10 11 12 | #### Collect the metrics from /stub_status location URL “http://localhost:80/stub_status” #### Forward metrics data to “collectd exporter” LoadPlugin network Server “prometheus.example.com” “25826” |
Restart collectd once done with configuration changes
3. Collectd Exporter
Unlike other monitoring stacks, like Graphite, Prometheus pull metrics from servers by scraping metrics endpoints exposed on each servers. As Collectd doesn’t have such endpoint, we will install “collectd exporter”
Collectd Exporter for Prometheus accepts collectd’s binary network protocol as sent by collectd’s network plugin and transforms and exposes them for consumption by Prometheus.
Download “collectd_exporter”
| 1 2 3 | wget https://github.com/prometheus/collectd_exporter/releases/download/0.2.0/collectd_exporter-0.2.0.linux-amd64.tar.gz |
extract it using following command
| 1 2 3 | tar –xvf collectd_exporter–0.2.0.linux–amd64.tar.gz |
Now we can run it using
| 1 2 3 | ./collectd_exporter –collectd.listen–address=0.0.0.0:25826 |
start collectd_exporter with “-collectd.listen-address=”:25826″ to start consuming and exporting the metrics metrics data sent by collectd.
4. Configure Prometheus
Finally we will configure Prometheus to Poll the “Collectd Exporter” for metrics data.
Download latest version of Prometheus binary from their github repo https://github.com/prometheus/prometheus
| 1 2 3 4 5 | wget https://github.com/prometheus/prometheus/releases/download/v1.2.1/prometheus-1.2.1.linux-amd64.tar.gz tar xvfz prometheus–1.2.1.linux–amd64.tar.gz cd prometheus–1.2.1.linux–amd64 |
There are two main files under this folder “prometheus-1.2.1.linux-amd64” , one is Prometheus binary and other one is config file prometheus.yml
Now we need to configure Prometheus to scrape the HTTP endpoint exposed by “collectd exporter” and collect the metrics
Add the following line in the prometheus.yml file
| 1 2 3 4 | static_configs: – targets: [‘192.168.2.21:9103] |
Config file will look like below
| 1 2 3 4 5 6 7 8 9 10 11 12 13 14 15 16 17 18 19 20 21 22 23 24 25 26 | # my global config global: scrape_interval: 15s # By default, scrape targets every 15 seconds. evaluation_interval: 15s # By default, scrape targets every 15 seconds. # scrape_timeout is set to the global default (10s). # Attach these labels to any time series or alerts when communicating with # external systems (federation, remote storage, Alertmanager). external_labels: monitor: ‘codelab–monitor’ # Load and evaluate rules in this file every ‘evaluation_interval’ seconds. rule_files: # – “first.rules” # – “second.rules” # A scrape configuration containing exactly one endpoint to scrape: # Here it’s Prometheus itself. scrape_configs: # The job name is added as a label job=<job_name> to any timeseries scraped from this config. – job_name: ‘nginx server’ # Override the global default and scrape targets from this job every 5 seconds. scrape_interval: 5s # metrics_path defaults to ‘/metrics’ # scheme defaults to ‘http’ static_configs: – targets: [‘192.168.2.21:9103’] |
Now we will start Prometheus , by running following command
| 1 2 3 | ./prometheus |
You can see it is started and listening on port 9090. Now we can access the Prometheus UI by launching the following URL in browser
http://192.168.2.21:9090 ( replace the IP address :))
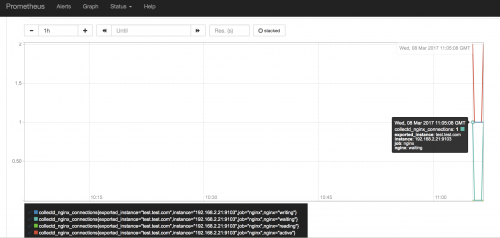
If everything goes fine, you should be able to see the metrics inside Prometheus UI . Please see screenshot below
5. Visualize metrics data using Grafana
Now we can configure Grafana to display the data stored in Prometheus. I have created a video on this. please check it out
Feel free to contact us if you face any issue ????