Netdata with Prometheus
Prometheus is a distributed monitoring system, which fetches and stores time-series data. It can also take actions on this data. Its widely popular and considered as a better alternative for popular Graphite database. It collects metrics from the configured targets at regular intervals , evaluate the rules and triggers alerts if some condition is observed to be true. Few of the main features of Prometheus database are
– multi-dimensional data model
– Powerful query language
– Uses “Pull model” to collect the timeseries data , Push method also available with the use of on an intermediary gateway
– Provides beautiful GUI with PromDash
Netdata
Netdata is an application which does realtime performance and health monitoring of your servers and applications. It is fast and efficient. You can see the metrics in almost realtime .
Traditionally, monitoring solutions centralize all metric data to provide unified dashboards across all servers. Agents collects the metrics and forwards to a central location, where user can see metrics from all servers. This convenience is not there with Netdata. With Netdata, metrics are stored locally and GUI also different for different machines. Also,historical data will be lost incase of any hardware issue on the Server. To avoid this situation, Netdata provides an HTTP api which can be used by Prometheus to collect the metrics which Netdata has collected from machines. Prometheus can scrape multiple servers with Netdata running and store the data on a Central server there user can see metrics from multiple servers.
Now we will see How to Install and configure Netdata with Prometheus
Install Netdata
Before you start installing netdata utility, make sure you have these basic build environment packages installed on the system, if not install it using your respective package managers like yum or apt-get
Yum install zlib-devel gcc make git autoconf autogen automake pkgconfig psmisc
Now we can download and install Netdata
#git clone https://github.com/firehol/netdata.git –depth=1
#cd netdata
#./netdata-installer.sh
This will install Netdata and you can start it by running following on the command line
/usr/sbin/netdata
By default Netdata listens to port 19999 and you can access it using ,
Http://192.168.2.21:19999/ ( please replace the IP address with your own IP)
There is also one api which is created for using with Prometheus , url is
Http://192.168.2.21:19999/api/v1/allmetrics?format=prometheus ( please replace the IP address with your own IP)
Install and configure Prometheus
We can download the binaries from https://prometheus.io/download/ . You can chose the binaries suitable for your system
For Centos 64 bit,
Wget https://github.com/prometheus/prometheus/releases/download/v1.2.1/prometheus-1.2.1.linux-amd64.tar.gz
tar xvfz prometheus-1.2.1.linux-amd64.tar.gz
cd prometheus-1.2.1.linux-amd64
Now you can configure it . Prometheus collects metrics from monitored targets by scraping metrics HTTP endpoints on these targets. All the definitions goes to a file prometheus.yml . Sample configuration is below
# my global config
global:
scrape_interval: 15s # By default, scrape targets every 15 seconds.
evaluation_interval: 15s # By default, scrape targets every 15 seconds.
# scrape_timeout is set to the global default (10s).
# Attach these labels to any time series or alerts when communicating with
# external systems (federation, remote storage, Alertmanager).
external_labels:
monitor: ‘codelab-monitor’
# Load and evaluate rules in this file every ‘evaluation_interval’ seconds.
rule_files:
# – “first.rules”
# – “second.rules”
# A scrape configuration containing exactly one endpoint to scrape:
# Here it’s Prometheus itself.
scrape_configs:
# The job name is added as a label job= to any timeseries scraped from this config.
– job_name: ‘netdata-scrape’
metrics_path: “/api/v1/allmetrics?format=prometheus”
static_configs:
– targets: [‘192.168.2.21:19999’]
You can see in the config file that we mentioned the Netdata server details and API path under the “scrape_configs” , when we start Prometheus , it will fetch the metrics from this api
Start Prometheus
You can start prometheus using following command
./prometheus
If there are no errors, you should be able to access the prometheus web interface at
Http://192.168.2.15:9090/
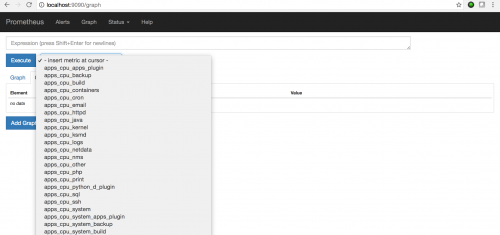
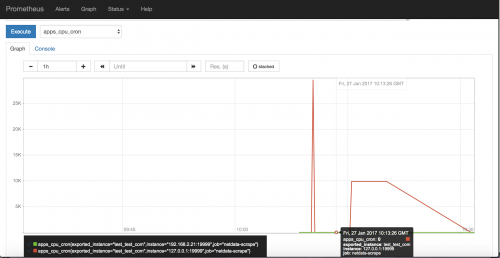
You should be able to see the metrics under the metrics drop down list. Please check attached screenshots

