Monitoring mysql with CollectD and Prometheus
Prometheus is a powerful monitoring and alerting solution for your system and application metrics. It is considered as a better alternative to to the popular Graphite tool. It has many more advanced and useful featured compared to Graphite and performance also superior. When combined with Grafana , it create a powerful monitoring stack with a beautiful GUI and alerting features. In this article we will discuss how to setup monitoring for your Mysql server using CollectD, Prometheus and Grafana
First we will go through the setup, design and role of individual components
A. CollectD
CollectD is a powerful performance monitoring application which can collect metrics and send it to various datastores like Graphite, Prometheus and Influxdb. It has lot of inbuilt plugins for collecting all important system metrics. We use CollectD “mysql” plugin to collect the metrics from our Mysql server and forward it to Prometheus. We create a mysql user on mysql server with “USAGE” privileges and Collectd plugin connect to Mysql server and collect the metrics at fixed intervals. These metrics would be forwarded to Prometheus via “Prometheus Collectd Exporter”
B. Prometheus and Prometheus “Collectd Exporter”
Prometheus collects metrics from monitored targets by scraping metrics HTTP endpoints on these targets. As Collectd doesn’t have any HTTP end points or Prometheus plugin, we will use another application “Prometheus Collectd Exporter” which creates HTTP end point on the Monitored machines from where Prometheus can pull the metric. We have to start this application on all the monitored servers and configure Collectd to to send metrics to the UDP port where “Prometheus Collectd Exporter” listening. Then we will configure Prometheus to scrape this HTTP endpoint for collecting metrics.
Now let us setup these components
1. Install Collectd
Collectd package is available for all major OS distros, we can use package managers like yum or apt-get to install Collectd
On Centos, we can use yum to install Collectd
Yum install collectd
On Ubuntu
Apt-get install collectd collectd-utils
Now we will configure Collectd
We have to create the user on mysql servers first ,
[[email protected] etc]# mysql -uroot -p
Enter password:
Welcome to the MySQL monitor. Commands end with ; or \g.
Your MySQL connection id is 10673
Server version: 5.5.52-cll-lve MySQL Community Server (GPL) by Atomicorp
Copyright (c) 2000, 2016, Oracle and/or its affiliates. All rights reserved.
Oracle is a registered trademark of Oracle Corporation and/or its
affiliates. Other names may be trademarks of their respective
owners.
Type ‘help;’ or ‘\h’ for help. Type ‘\c’ to clear the current input statement.
mysql> grant usage on *.* to [email protected]”%” identified by “mypassword” ;
Query OK, 0 rows affected (0.00 sec)
We will use above credentials in the Collectd configuration
Enable Mysql plugin by adding following into the Collectd config file “/etc/collectd.conf” file
LoadPlugin mysql
Host “127.0.0.1”
User “metricuser”
Password “mypassword”
MasterStats true
Host “localhost”
Socket “/var/run/mysql/mysqld.sock”
SlaveStats true
SlaveNotifications true
### Config entries shown below will enable Network plugin and forward the mysql metrics to Prometheus exporter
LoadPlugin network
Server “192.168.2.21” “65534”
Replace the mysql server IP, username and password with your server details. Once done with config changes, we will restart collectd
2. Configure Prometheus and Collectd exporter for Prometheus
Now we will install Prometheus and “Collectd exporter for Prometheus”. Download the latest binaries from Github repos and start services
Collectd exporter for Prometheus
Unlike other monitoring stacks, like Graphite, Prometheus pull metrics from servers by scraping metrics endpoints exposed on each servers. As collectd doesnt have such endpoint, we will install “collectd exporter”
Download collectd_exporter
Wget https://github.com/prometheus/collectd_exporter/releases/download/0.2.0/collectd_exporter-0.2.0.linux-amd64.tar.gz
Extract it using following command
Tar -xvf collectd_exporter-0.2.0.linux-amd64.tar.gz
Now we can run it using
./collectd_exporter -collectd.listen-address=0.0.0.0:65534
Please note the listen-address port number 65534, we have configured Collectd to send metrics to this port. Collectd exporter exposes metrics on another HTTP port, 9103. Prometheus will connect to this port for collecting metrics
Download and install Prometheus
Download latest version of Prometheus binary from their github repo https://github.com/prometheus/prometheus
Wget https://github.com/prometheus/prometheus/releases/download/v1.2.1/prometheus-1.2.1.linux-amd64.tar.gz
tar xvfz prometheus-1.2.1.linux-amd64.tar.gz
cd prometheus-1.2.1.linux-amd64
There are two main files under this folder prometheus-1.2.1.linux-amd64, one is Prometheus binary and other one is config file prometheus.yml
Now we need to configure Prometheus to scrape the HTTP endpoint exposed by “collectd exporter” and collect the metrics
Config file will look like below
# my global config
global:
scrape_interval: 15s # By default, scrape targets every 15 seconds.
evaluation_interval: 15s # By default, scrape targets every 15 seconds.
# scrape_timeout is set to the global default (10s).
# Attach these labels to any time series or alerts when communicating with
# external systems (federation, remote storage, Alertmanager).
external_labels:
monitor: ‘codelab-monitor’
# Load and evaluate rules in this file every ‘evaluation_interval’ seconds.
rule_files:
# – “first.rules”
# – “second.rules”
# A scrape configuration containing exactly one endpoint to scrape:
# Here it’s Prometheus itself.
scrape_configs:
# The job name is added as a label job= to any timeseries scraped from this config.
– job_name: ‘mysqlserver’
# Override the global default and scrape targets from this job every 5 seconds.
scrape_interval: 5s
# metrics_path defaults to ‘/metrics’
# scheme defaults to ‘http’
static_configs:
– targets: [‘192.168.2.21:9103’]
Now we will start Prometheus , by running following command
[[email protected] prometheus-1.0.1.linux-amd64]# ./prometheus
INFO[0000] Starting prometheus (version=1.0.1, branch=master, revision=be40190) source=main.go:73
INFO[0000] Build context (go=go1.6.2, [email protected], date=20160722-19:54:46) source=main.go:74
INFO[0000] Loading configuration file prometheus.yml source=main.go:206
INFO[0000] Loading series map and head chunks… source=storage.go:341
INFO[0000] 212 series loaded. source=storage.go:346
WARN[0000] No AlertManagers configured, not dispatching any alerts source=notifier.go:174
INFO[0000] Listening on :9090 source=web.go:234
INFO[0000] Starting target manager… source=targetmanager.go:74
You can see it is started and listening on port 9090. Now we can access the Promethus UI by launching the following URL in browser
Http://192.168.2.21:9090 ( replace the IP address :))
It will show the Mysql metrics . Please see the screenshots below
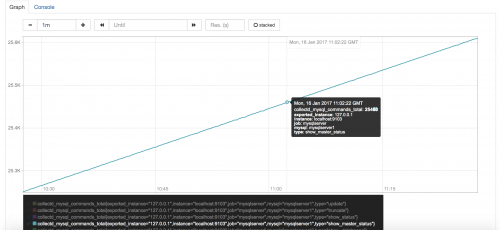
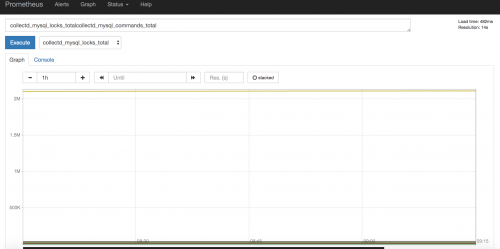
As you can see mysql metrics started showing up in the Prometheus web UI. This UI is not good compared to Grafana UI . So let us add these graphs to grafana and create dashboards. I have created a video on this . Please check it